MATLAB Command Line
Click to copy the following command line to the clipboard. Then paste it in the MATLAB Command Window:
winopen(fullfile(qc_root, 'quarc', 'quarcdemos', 'quarc_labview_sine_demo_client.vi')); quarc_labview_sine_demo_serverQUARC LabVIEW Interfacing Demo
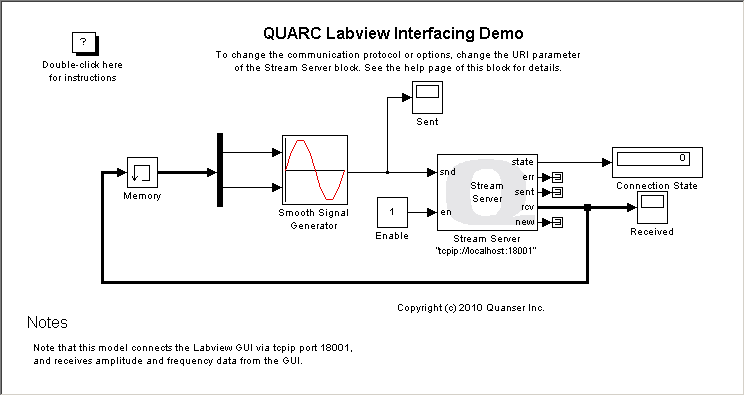
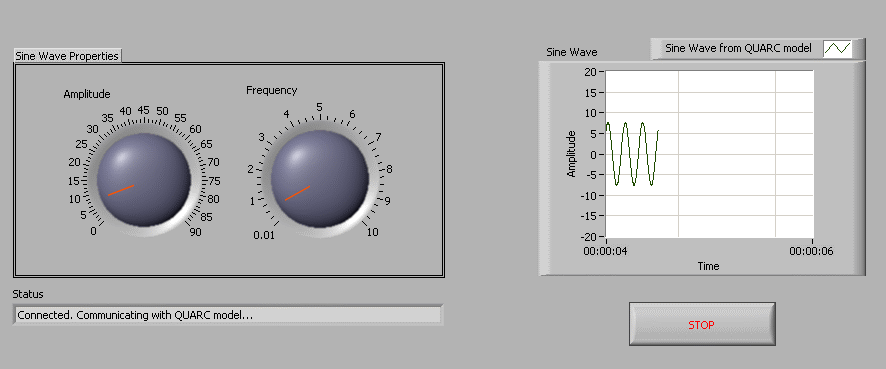
This example consists of a QUARC model and a LabVIEW GUI. A sine wave is transmitted from the QUARC model to the LabVIEW GUI. The amplitude and frequency of the wave can be adjusted from the GUI, and the values will be transmitted via TCP/IP connection to the QUARC model, where the sine wave is produced based on the received data. The GUI and the model can be run on the same computer or two separate computers within a network.

Requirements
LabVIEW 2009 or later must be installed.
Configuration the Demonstration
To set up the model, double-click on the Stream Server block in the quarc_labview_sine_demo_server.mdl MATLAB Command Line Click to copy the following command line to the clipboard. Then paste it in the MATLAB Command Window: qc_open_library('quarc_labview_sine_demo_server') model and make sure the URI upon which to listen parameter is set to listening on localhost.
To run the GUI on the same computer, enter the block diagram of the GUI and make sure it is connecting to localhost and the port number is consistent with the number in the QUARC model URI.
To run the GUI on another computer, enter the block diagram of the GUI and make sure it is connecting to the IP address of the computer where the QUARC model is running and the port number is consistent with the number in the QUARC model URI.
Demonstration
Select from the menu of the diagram, or press Ctrl+B while the diagram is the active window. A great deal of output will appear in the Diagnostic Viewer about the progress of the build. If you cannot see the Diagnostic Viewer, you can open it by selecting from the menu of the diagram, or clicking on the View Diagnostics hyperlink at the bottom of the diagram. If you have MATLAB R2013b or earlier then the output will appear in the MATLAB Command Window.
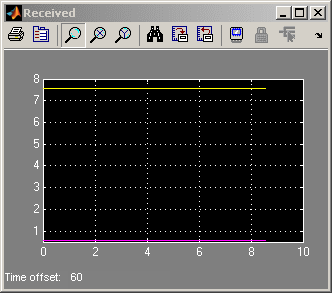
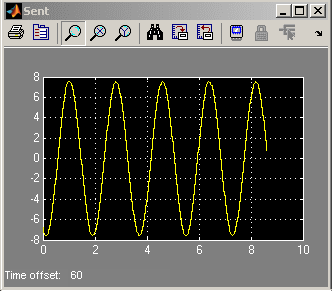
Double-click on the "Received" Scope block in the quarc_labview_sine_demo_server.mdl MATLAB Command Line Click to copy the following command line to the clipboard. Then paste it in the MATLAB Command Window: qc_open_library('quarc_labview_sine_demo_server') model to open the scope if it's not already open. Do the same for the "Sent" scope block in the same model.
Click on the button or select from the menu of the diagram to connect to the model.
Start the model by clicking on the button or selecting from the menu of the diagram. The item of the menu may also be used to both connect and start the model in one operation.
The sampling time can be changed by updating the value of Fixed-step size in .
Now in the LabVIEW GUI, click button to start the process. A sine wave will appear on the scope in the GUI, also in the "Sent" scope in the QUARC model. In the "Received" scope in the QUARC model, the values of amplitude and frequency are illustrated.


Click on the button or select from the menu of the diagram to stop the model. The item of the menu may also be used.
Click the button of the VI to halt the LabVIEW GUI.
Copyright ©2025 Quanser Inc. This page was generated 2025-11-01. Submit feedback to Quanser about this page.
Link to this page.