
Creating MATLAB GUIs
QUARC can be used along with MATLAB's GUI creation tools to create graphical user interfaces in which you can perform tasks defined and designed by yourself that best suit your needs. For example you may have a complex Simulink model that implements a PID controller and want to monitor the change in step response as you change various gains in your diagram. Although this can be done in Simulink, using techniques such as Parameter Tuning, you could alternatively design a GUI in which you vary your gains using sliders and monitor the change in outputs directly on a plot. You can even have buttons for building, starting and stopping the model from the GUI so that your Simulink model doesn't even need to be open. This section describes how GUI's can be created and used by means of a simple walkthrough example. This example illustrates the basic principles of creating GUI's and linking them to your Simulink models. These principles can later be applied to design GUI's depending on your specific needs. You can refer to the QUARC MATLAB GUI Demo page to access the model and the GUI used as the examples in this section.
Suppose that your Simulink model consists of a signal source that is directly connected to a Time Figure block. This section will illustrate how a GUI can be created from which you can build, start and stop this model, monitor the output and observe its changes when the input is varied. This may be a simple model and creating a GUI to perform these tasks might sound irrelevant. However as explained above, the principle can be applied to more complex cases such as changing controller gains and monitoring the step response of a system. In both scenarios the purpose of the GUI is to provide an environment where building/starting/stopping the model, tuning parameters and monitoring resulting changes can all be done outside Simulink and from a single easy-to-use interface.
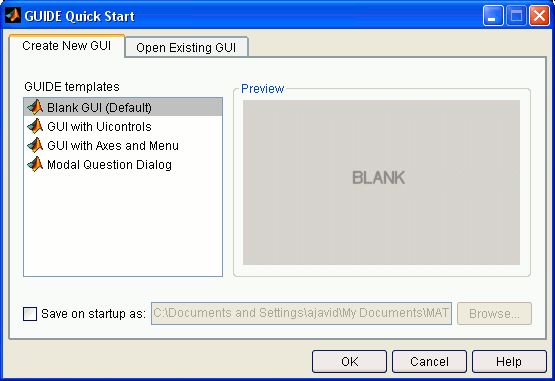
In order to start creating a GUI you can either type guide in the MATLAB Command Prompt or select from the MATLAB Window menu. You can also use the button in the MATLAB toolbar.In all cases, a window pops up as shown below.

The option can be selected under the GUIDE templates tab in order to create a GUI with an interface designed completely by the user. Other templates are also available under this tab that can be used depending on user preferences and needs. Once you select and click on OK, a window will open in which you can design your GUI. The toolbar on the left side of this window provides tools to insert buttons, axes, sliders, etc. into the GUI. For more convenience, you can have names shown on each toolbar button to specify what each one does. This can be done by selecting and checking the box next to "Show names in component palette" if it is not checked already.
As mentioned above, the GUI to be created in this example will be linked to a Simulink model that consists of a signal source (sine wave) that is connected to a Time Figure block which can be found in the Simulink Library Browser under the QUARC Targets/Sinks MATLAB Command Line Click to copy the following command line to the clipboard. Then paste it in the MATLAB Command Window: qc_open_library('quarc_library/Sinks'); library. You will need to create this model and save it. The name you give to your model will be used later in the GUI creation process. In this example the name "quarc_matlab_gui_demo" will be used to refer to this model.
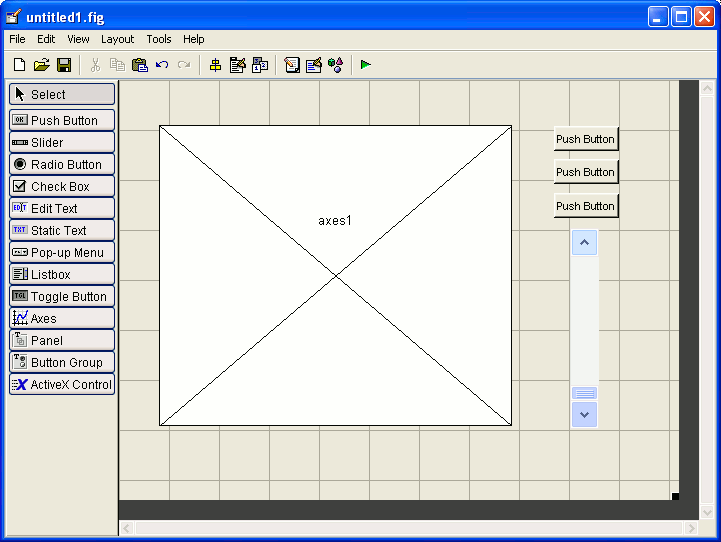
The GUI will consist of three push buttons (one for building, one for starting and one for stopping the model), one slider (to change the sine wave frequency) and one axes (to monitor the signal connected to the Time Figure block. To insert each of these components into the GUI, you should click on the appropriate button in the toolbar and draw the component in the GUI. For example to insert the slider, click on the button in the toolbar, move your cursor over to the grid and draw a box. Once you have inserted all the above-mentioned components your window should look like the one depicted below:

Once the basic structure of the GUI is created, it is time to configure the GUI
to talk to your Simulink diagram and also specify the action that must be taken
once each button in the GUI is pressed. The first thing you need to do is to open
your Simulink diagram and double-click on the Time Figure
block. A new window will open with horizontal and vertical axes. Click on the Time
Figure properties button which is the third button from right on the toolbar appearing
above the axes. The Sink Block Properties: Time Figure window opens. Use the drop-down list for
the Figure mode parameter to select
"Use axes in GUI" for the figure mode. You will notice that the Axes tag
parameter shows axes1 which is the same as the tag shown on the axes in the GUI you have
created. Click on OK.
You can change the names that appear on your push buttons to distinguish which one builds the model, which one starts the model and which one stops it. In your GUI, right-click on the first push button and select the menu item. In the Inspector window that opens, look for the String cell. The value shown in front of this cell is what is shown on the push button. For this example change the String value from "Push Button" to "Build". You will notice that there is also a cell called Tag with "pushbutton1" as its value. This tag is used to identify the button in the M-file generated when you save your GUI as a ".fig" file. Since you will need to make modifications to the code inside the M-file depending on your needs, you should change this tag to a name that is easier for you to distinguish from other buttons. For this example, change the tag value to "pushbuttonBuild" to indicate that the tag is assigned to the "Build" push button. The same steps as outlined above should be taken for the other two push buttons. The Strings should be changed from "Push Button" to "Start" and "Stop" and the tags should be changed from "pushbutton2" and "pushbutton3" to "pushbuttonStart" and "pushbuttonStop" respectively.
The slider will be used to change the frequency of the sine wave. Therefore a frequency range must be specified to indicate the minimum and maximum frequencies that the slider should apply. In other cases, where for example the slider is being used to change a gain in the diagram, appropriate minimum and maximum values for the gains should be assigned to the slider. For this example, the lowest frequency to apply is chosen to be 1 Hz while the highest is chosen to be 100 Hz. In order to specify these lower and upper bounds, right-click on the slider in your GUI and select the menu-item. In the Inspector window, look for the Min and Max cells and change their values to 1 and 100 respectively. The Value cell should also be changed to indicate a non-zero frequency. Therefore change this cell's value to 10. You can also assign your choice of tag to this component in the GUI. For this example "sliderFrequency" is being used as the tag.
The first time that you save your GUI, a ".m" file gets created and opened in the MATLAB Editor with
the same name as the one you have assigned to your GUI. It is in this file where
you can specify the action to be taken when each button is pressed or the slider value is changed. For the example
being followed throughout this page the name "quarc_creating_matlab_guis_demo" has been chosen. You
need to specify the model that your GUI should be linked to. This can be done by
including the following lines in the quarc_creating_matlab_guis_demo_OpeningFcn
function. They should be inserted right before the guidata(hObject, handles); command:
handles.model = 'quarc_matlab_gui_demo';
load_system(handles.model);
Please note that "quarc_matlab_gui_demo" is the name assigned to the Simulink model. In order to specify the action to be taken when the "Build" button is pressed, right-click on this button in your "quarc_creating_matlab_guis_demo.fig" file and select the menu item. You will be taken to the M-file for your GUI. Add the following line to the pushbuttonBuild_Callback function:
qc_build_model(handles.model);
The qc_build_model function is used here to build the model. In other situations and depending on the task you would like your button to perform, you can use other MATLAB function including the QUARC MATLAB Functions to specify the action to be taken.
In order to specify the action to be taken when the "Start" button is pressed, right-click on this button in your "quarc_creating_matlab_guis_demo.fig" file and select the menu item. You will be taken to the M-file for your GUI. Add the following line to the pushbuttonStart_Callback function:
qc_start_model(handles.model);
The qc_start_model function is used here to start the model.
In order to specify the action to be taken when the "Stop" button is pressed, right-click on this button in your "quarc_creating_matlab_guis_demo.fig" file and select the menu item. You will be taken to the M-file for your GUI. Add the following line to the pushbuttonStop_Callback function:
qc_stop_model(handles.model);
The qc_stop_model function is used here to stop the model.
In order to specify the action to be taken when the slider is varied, right-click on the slider in your "quarc_creating_matlab_guis_demo.fig" file and select the menu item. You will be taken to the M-file for your GUI. Add the following line to the sliderFrequency_Callback function:
value = get(hObject, 'Value');
set_param([handles.model, '/Sine Wave'], 'Frequency', num2str(value));
Please note that the "Sine Wave" parameter in the above function must be the same as the name assigned to the Sine Wave block in "quarc_matlab_gui_demo.mdl". If you have modified the name of this block in your diagram, replace "Sine Wave" in the above function with that name.
In order to specify the action to be taken when the user attempts to close the GUI,
right-click anywhere on the grid background of "quarc_creating_matlab_guis_demo.fig" and select the
menu item. You will be taken to
the M-file for you GUI. Add the following line to the
figure1_CloseRequestFcn function, before the delete(hObject); line:
close_system(handles.model, 0);
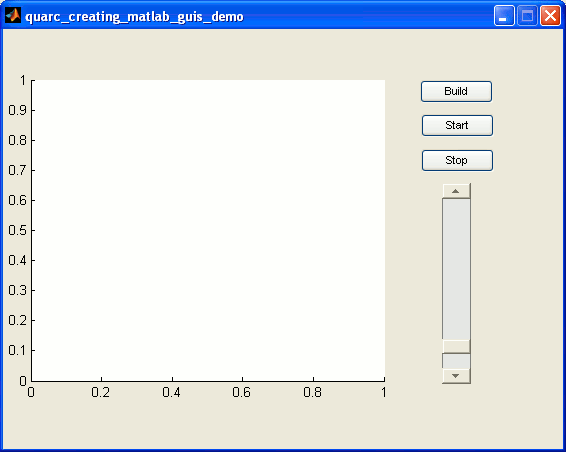
Your GUI is now fully configured. As seen in a number of steps mentioned above, there are additional options available such as Callbacks that provide different kinds of functionality and can be used depending on your needs. You should consult the MathWorks documentation for details on each of these options. To start using your GUI, save "quarc_creating_matlab_guis_demo.fig" and run it by clicking on the button which is the last button in the GUIDE toolbar. You can also run the "quarc_creating_matlab_guis_demo.m" M-file by clicking on the button in the MATLAB editor toolbar or pressing F5. Your complete GUI will open and should look like the figure below.

You can now use this simple GUI to build, start and stop the model without having the Simulink diagram open. You can also change the frequency of your sine wave by using the slider and see its effect immediately on the plot. Please note that once you have completely created a GUI, you can simply run it by typing its name in the MATLAB Command Prompt. For the example illustrated in this page you can type quarc_creating_matlab_guis_demo in the MATLAB Command Prompt to open the window depicted in the above figure.
 Every time you wish to open a MATLAB GUI, you should open the M-file for your figure and run it,
open your figure in GUIDE and run it from GUIDE or type in the name of the GUI without any file extension.
If you open the file with the ".fig" extension directly,
you will encounter errors as some variables do not get initialized while the other methods initilize these variables
at startup.

Copyright ©2025 Quanser Inc. This page was generated 2025-11-01. Submit feedback to Quanser about this page.
Link to this page.