MATLAB Command Line
Click to copy the following command line to the clipboard. Then paste it in the MATLAB Command Window:
quarc_matlab_gui_demo; edit quarc_creating_matlab_guis_demo.mQUARC MATLAB GUI Demo
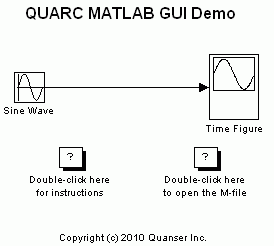
This demonstration includes a Simulink model and a MATLAB GUI created using the GUIDE application which can be used to build, start and stop the model in addition to perform online parameter tuning of the model. For information on how to create MATLAB GUIs and modify them to control Simulink models, please refer to the Creating MATLAB GUIs section.


We have used a Time Figure block from the QUARC Targets library as our Sink block. This choice gives us the ability to display the plot of the input signal to this block in a MATLAB GUI. For information on this block, you can refer to the Time Figure block reference page.
Configuring the Demonstration
To set up the demonstration, right-click on the Time Figure block and select the
item from the context menu. In the Sink Block Parameters dialog, use the drop-down list for the Figure mode
parameter and make sure the Use axes in GUI option is chosen. The value for Figure tag and
Axes tag should be figure1 and axes1 respectively. Changing these tags will result in the GUI
not being able to display the input signal to the Time Figure block.
Demonstration
Building, deploying and starting the model
Refer to One Step Process in QUARC Basic Procedures to build, deploy and start the model.
Running the model
Open the quarc_creating_matlab_guis_demo.m M-file in a MATLAB editor.
Run the M-file by pressing F5 or clicking on the toolbar button.
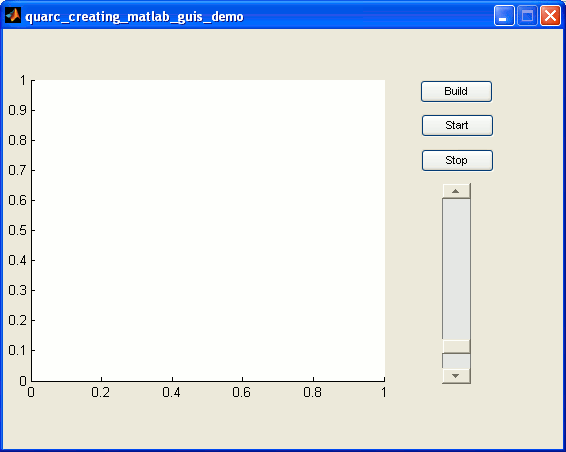
A MATLAB GUI opens in a separate window similar to the following figure.

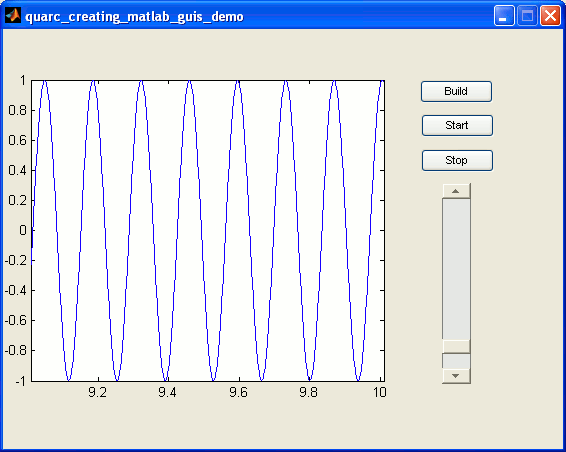
A signal gets displayed on the GUI plot as shown below.

Now, use the sidebar in the GUI to increase/decrease the frequency of the sine wave and notice how the plot gets updated by changing the frequency of the signal (you have just performed online parameter tuning using your MATLAB GUI).
Stopping the model and script
Stop the model by clicking on the Stop button on the GUI.
 Every time you wish to open a MATLAB GUI, you should open the M-file for your figure and run it,
open your figure in GUIDE and run it from GUIDE or type in the name of the GUI without any file extension.
If you open the file with the ".fig" extension directly,
you will encounter errors as some variables do not get initialized while the other methods initialize these variables
at startup.
Running the example on a different target
To run the example on a different target, refer to the instructions on the Running QUARC Examples on Remote Targets page.
Copyright ©2025 Quanser Inc. This page was generated 2025-11-01. Submit feedback to Quanser about this page.
Link to this page.