
Debugging a Model
QUARC provides the means to debug a model on the target using a debugger compatible with the compiler employed to build the model code. For the QUARC Windows target, the Microsoft Visual Studio debugger may be used. However, debugging information must be included in the generated code for the model. Debugging information is not included in the generated code by default. However, QUARC allows you to enable the generation of debugging information so that you may debug your models. This feature is particularly useful for debugging user-created S-functions in the model. This section describes the steps required to start the debugging process using Microsoft Visual Studio. It does not cover the debugging process itself as it is out of scope of this document. For information on this topic, you can refer to the corresponding help section of your Microsoft Visual Studio software release.
Please perform the following steps to be able to debug your model in Microsoft Visual Studio:
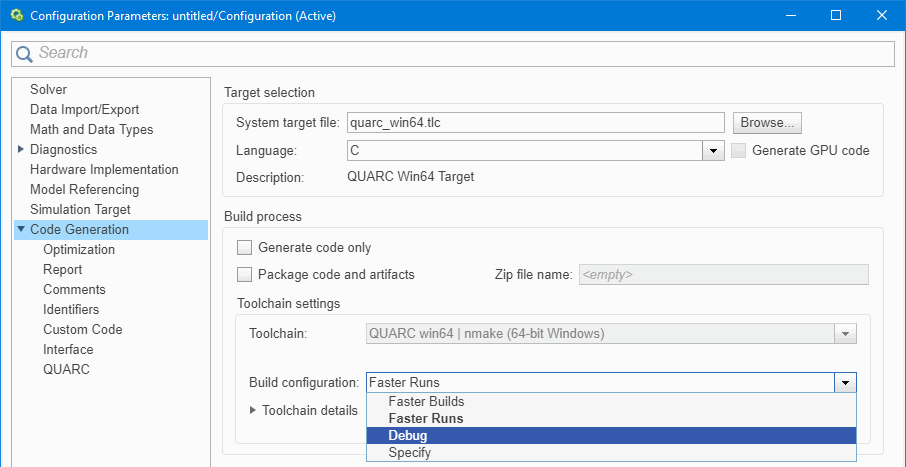
Open the Configuration Parameters dialog box using one of the methods discussed in the Configuring a Model section in the QUARC documentation and select the Code Generation/QUARC pane.
Click on the Build configuration dropdown box in the Code Generation pane, and select Debug as shown in figure below.

Click on . Build the model as discussed in the Building a Model section of the QUARC documentation. The model may take longer to build because it compiles any source libraries with debugging as well.
Once the model is built and the real-time code is generated, connect to it as described in the Connecting to a Model's Real-Time Code section of the QUARC documentation. Do not start the model yet.
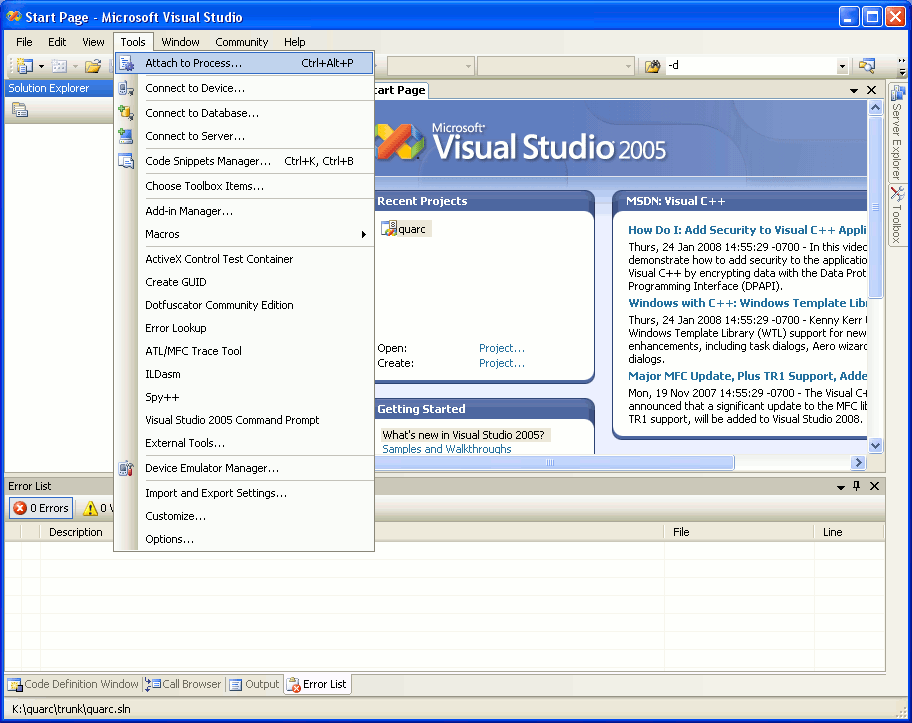
Open Microsoft Visual Studio and select the menu item as shown below, or alternately press Ctrl+Alt+P to open the Attach to Process dialog.

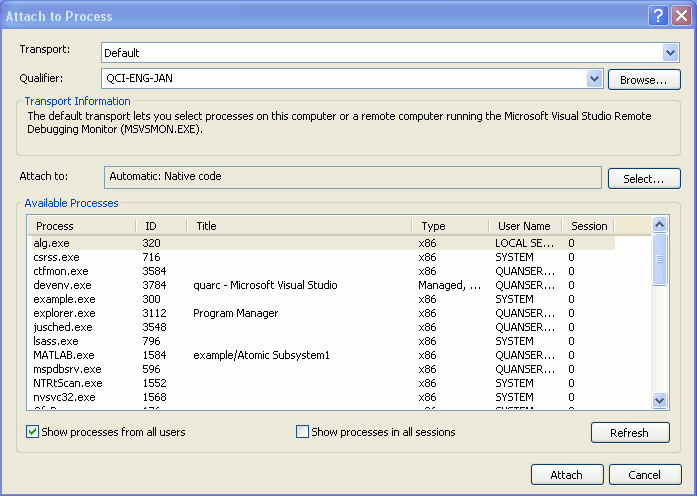
In the Attach to Process dialog, click on the checkbox beside Show processes from all users to show all the processes running on the system as shown in the figure below.

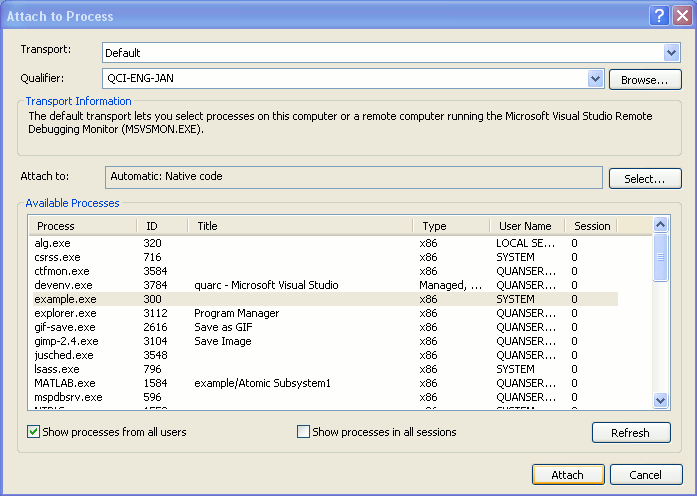
Select the process to which you wish to attach the debugger. In this case, it would be the real-time code generated for the model. The real-time process will have the name <model>.exe, where <model> is the name of your model. Select the real-time code process and click on Attach as depicted in the figure below. (The real-time code used for the purpose of this document is called example.exe).

The Microsoft Visual Studio debugger is now attached to the real-time code. Set breakpoints in any of the C code generated. For user-written S-functions, you may set breakpoints in the source code for the S-function.
Once all the breakpoints are set, start the model as described in the Starting a Model section of the QUARC documentation. You may now trace the flow of the program using the breakpoints and debug your model using the Microsoft Visual Studio debugger.

Copyright ©2025 Quanser Inc. This page was generated 2025-11-01. Submit feedback to Quanser about this page.
Link to this page.