
QUARC Figures
QUARC provides three special sink blocks for displaying signals in the model: Time Figure, XY Figure and Display Image. The Time Figure block plots its input versus time. The XY Figure block plots its X and Y input signals on an X-Y graph. Finally, the Display Image block shows the instantaneous value of its input as a two-dimensional image. These blocks may be found in QUARC Targets/Sinks MATLAB Command Line Click to copy the following command line to the clipboard. Then paste it in the MATLAB Command Window: qc_open_library('quarc_library/Sinks'); library in the Simulink Library Browser.
On the surface, the Time Figure and XY Figure blocks appear very similar to the Scope block and XY Graph blocks provided with Simulink. However, there are some important differences, not the least of which is the ability of the QUARC blocks to optionally display their plots on the axes within a MATLAB GUI created with GUIDE. This feature allows plotting facilities to be fully integrated into MATLAB GUIs. The XY Figure block also has performance that is far superior to the XY Graph provided with Simulink. There are other important and practical differences that are discussed in the following sections:
Time Figure
The Time Figure block plots its input versus time. The axes upon which it draws its plot can either be a MATLAB figure window (hence the name "Time Figure") or the axes within a MATLAB GUI. This second option is very useful in the case where you have a customized GUI and want to integrate the plot into the GUI. None of the blocks supplied with Simulink have this capability. Please refer to the Creating MATLAB GUIs section in the QUARC documentation for more details on how to integrate a plot generated by the Time Figure block into a GUI.
The Time Figure block adds extra toolbar buttons to the figure window and a context menu to the axes of the MATLAB GUI for accessing the block properties, autoscaling the plot, and opening the help for the block. Refer to the Time Figure block reference page for more details on these features.
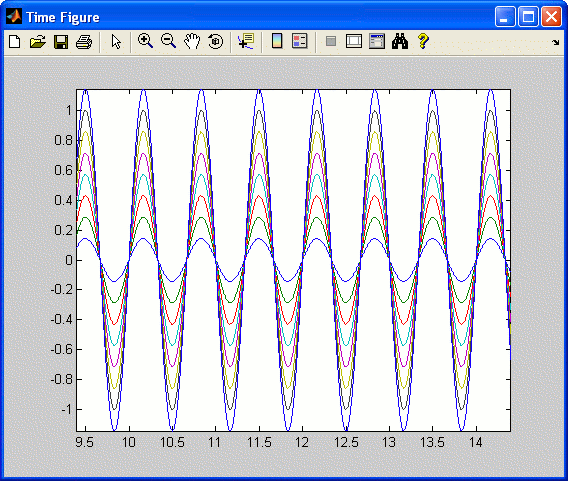
Below is an illustration of a Time Figure plot when it is plotting in a MATLAB figure window.

The advantage of plotting directly to a MATLAB figure is that more options are available for manipulating, analyzing and saving the data in the figure than those available with a standard Scope block. All the options available with a MATLAB figure are now available for your plot as well. Consider the following sample list of features available to the user when using the Time Figure block:
The Data Cursor feature may be used to find the value of a particular point on the plot, such as the rise time or overshoot of a step response. In fact, multiple data cursors may be placed on the plot (right-click on the first data tip and select the appropriate option).
The Pan option is available for panning your plot in order to see different segments of the data.
The plot may be saved to different types of files, such as ".gif", ".fig" and ".pfd" files.
For more information on the different features of the Time Figure window and MATLAB figures in general, please refer to the Figure Toolbars MATLAB Command Line Click to copy the following command line to the clipboard. Then paste it in the MATLAB Command Window: qc_open_matlab_help('figure_tool_bars') section in the MATLAB documentation. The Time Figure block allows you to access all these features just by double-clicking on the block to open the figure window. To get the same features with a Scope, you would have to save the data to the MATLAB workspace, use the MATLAB plot function to plot the data in a figure window and then use these features.
The Time Figure block is capable of plotting vector inputs as multiple curves on its axes, in different colours. It does not support multiple sets of axes, or subplots, at present. The Time Figure block supports signal triggering, as discussed in Signal Triggering. For a complete description of the Time Figure block, please refer to the Time Figure block reference page.
XY Figure
The XY Figure plots its X and Y inputs on an X-Y graph. The axes upon which it draws its plot can either be a MATLAB figure window (hence the name "XY Figure") or the axes within a MATLAB GUI. This second option is very useful in the case where you have a customized GUI and want to integrate the plot into the GUI. None of the blocks supplied with Simulink have this capability. Please refer to the Creating MATLAB GUIs section in the QUARC documentation for more details on how to integrate a plot generated by the XY Figure block into a GUI.
The XY Figure block adds extra toolbar buttons to the figure window and a context menu to the axes of the MATLAB GUI for accessing the block properties, autoscaling the plot, and opening the help for the block. Refer to the XY Figure block reference page for more details on these features.
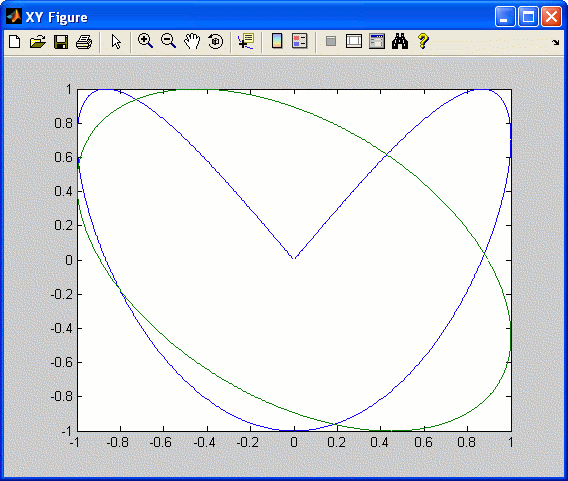
Below is an illustration of a XY Figure plot when it is plotting in a MATLAB figure window.

A very important difference between the XY Figure and the XY Graph provided by Simulink is their performance. The XY Graph provided by Simulink is very inefficient and cannot even keep up with real-time unless the input is decimated in most cases. As a result, it can even interfere with other display blocks in the model. To prove this fact, you can easily create an example model with one XY Graph and one Scope with a source block connected to the Scope. Simulate the model in normal mode. Notice how slow the Scope plots data. If you close the XY Graph window, data collection becomes faster but is still not optimal due to the presence of the XY Graph. Create another example, but this time use the XY Figure block provided with QUARC instead of the XY Graph. Notice that data collection is not only much faster, but the Scope is no longer affected.
Another major difference between these two blocks is that the XY Figure block accepts vector inputs and plots each pair of X-Y inputs as a separate curve on the X-Y graph, with each curve a different color. The XY Graph provided by Simulink cannot plot vector inputs. If you try to connect a vector input to any of its input ports, Simulink issues an error message.
A key advantage to plotting directly to a MATLAB figure window is that all the features of a MATLAB figure window, such as panning, data cursors and saving to various file formats, are available with the XY Figure block. See the discussion of the Time Figure block for more details on these features.
Due to the advantages mentioned above, with the most important one being the performance advantage, it is highly recommended that the XY Figure block always be used in place of the XY Graph provided by Simulink.
For a complete description of this block, please refer to the XY Figure block reference page in the QUARC documentation.
Display Image
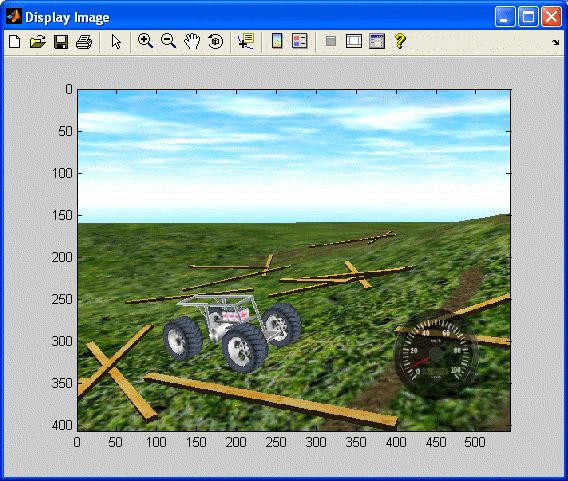
The Display Image takes a matrix input and displays
that input as an image. The image is redrawn as the input changes, enabling "live"
images to be displayed. If the input is an h x w x 3 matrix then it
is interpreted as an RGB image of width, w, and height, h.
If the input is an h x w matrix then it is interpreted as a grayscale
(Y8) image of width, w, and height, h. The axes upon which
it draws its image can either be a MATLAB figure window or the axes within a MATLAB
GUI. This second option is very useful in the case where you have a customized GUI
and want to integrate the live image into the GUI. None of the blocks supplied with
Simulink have this capability. Please refer to the Creating
MATLAB GUIs section in the QUARC documentation for more details on how to integrate
a live image generated by the Display Image block
into a GUI.
Below is an illustration of a Display Image output when it is plotting in a MATLAB figure window.

For a complete description of this block, please refer to the Display Image block reference page in the QUARC documentation.

Copyright ©2025 Quanser Inc. This page was generated 2025-11-01. Submit feedback to Quanser about this page.
Link to this page.